
 (Graphic: Business Wire)")
 (Graphic: Business Wire)")
MEXICO CITY--(BUSINESS WIRE)--Mexichem, S.A.B. de C.V. (BMV: MEXCHEM*) (“the Company” or “Mexichem”) today released unaudited results for the second quarter of 2019.
“Since we kicked off our transformation in March 2018 to evolve into a purpose-driven, future fit organization, we have accomplished work on a number of overarching initiatives including: restructuring our Go-to-Market organization to enhance customer centricity; prioritizing capital allocation to continue improving ROIC; and executing company-wide efforts on talent, human-centered innovation, digital readiness, operational excellence and the circular economy,” said Mexichem CEO Daniel Martínez-Valle. ”Furthermore, in a launch planned for early September, we intend to change our corporate name and brand, subject to shareholder approval. This is central to our identity and embodies the scope of our entire transformation.”
Martínez-Valle added, “We remain focused on, and excited, about the company’s long-term strategy, and are committed to taking every step necessary to unlock shareholder value, including exploring strategic alternatives for our Vinyl business.”
In regards to our performance in the second quarter, as expected, the PVC and caustic soda market conditions remained challenging, along with Fluor’s Downstream business, which was materially impacted in Q2 by the illegal importation and selling of refrigerant gases into the EU in breach of the EU F-gas regulations.
We expect these challenges to continue into the second half of the year. However, we’re already starting to see sequential improvements for some of our business sectors, specifically, in our Vinyl business. Furthermore, growth in our Fluor Upstream business is expected to partially offset the challenges in our Fluor Downstream business.
SECOND QUARTER 2019 FINANCIAL RESULTS
| mm US$ | Second Quarter | January - June | ||||||||||
| Financial Highlights | 2019 |
|
2018 |
|
%Var. | 2019 |
|
2018 |
|
% Var. | ||
| Net sales | 1,839 |
|
1,968 |
|
-7 |
% |
3,605 |
|
3,724 |
|
-3 |
% |
| Operating income | 237 |
|
317 |
|
-25 |
% |
423 |
|
543 |
|
-22 |
% |
| EBITDA | 372 |
|
423 |
|
-12 |
% |
690 |
|
753 |
|
-8 |
% |
| EBITDA margin | 20.2 |
% |
21.5 |
% |
-129 bps | 19.1 |
% |
20.2 |
% |
-108 bps | ||
| EBITDA wo IFRS 16 effect | 353 |
|
423 |
|
-17 |
% |
653 |
|
753 |
|
-13 |
% |
| EBT | 160 |
|
262 |
|
-39 |
% |
276 |
|
425 |
|
-35 |
% |
| Income (loss) from continuing operations | 113 |
|
186 |
|
-39 |
% |
190 |
|
297 |
|
-36 |
% |
| Consolidated net income (loss) | 113 |
|
206 |
|
-45 |
% |
190 |
|
317 |
|
-40 |
% |
| Net majority income | 84 |
|
162 |
|
-48 |
% |
132 |
|
241 |
|
-45 |
% |
| Operating cash flow before capex, buy-back shares program & dividends | 217 |
|
253 |
|
-14 |
% |
175 |
|
225 |
|
-22 |
% |
| Total CAPEX (organic & JV) | (61 |
) |
(70 |
) |
-13 |
% |
(121 |
) |
(136 |
) |
-11 |
% |
| Operating cash flow before buy-back shares program & dividends | 156 |
|
183 |
|
-15 |
% |
54 |
|
89 |
|
-39 |
% |
| Free cash flow | 65 |
|
104 |
|
-38 |
% |
(114 |
) |
(79 |
) |
44 |
% |
As of January 1, 2019, the Company adopted the new lease accounting standard (IFRS 16). Results for 2019 are presented under IFRS 16, while prior period amounts continue to be reported in accordance with our historic accounting, as required under the standard. Pro Forma 2019 EBITDA excluding the impact of the new lease standard is presented for comparative purposes.
The current quarter includes a $19.1 million favorable impact on EBITDA from the IFRS 16 adoption. The most significant benefits were $10 million in the Fluent Business Group and $8 million in the Vinyl Business Group.
While we had a challenging first half of the year mainly due to tough market conditions in some of our businesses, we are expecting sequential improvement going into the second half. In this context, we’re unremittingly improving operational efficiencies and controlling costs in all our businesses, focusing on optimizing our working capital management across all our businesses, and continuing to emphasize safety and security. For the full year, due to uncertainty in the global macro economic environment and market dynamics across our industries, Mexichem is adjusting its 2019 EBITDA guidance to -6% to -1% compared to 2018 reported EBITDA.
Unless noted otherwise, all figures in this release are derived from the Interim Consolidated Financial Statements of the Company as of June 30, 2019 and are prepared in accordance with International Accounting Standard 34 “Interim Financial Reporting” of the International Financial Reporting Standards (IFRS), which have been published in the Bolsa Mexicana de Valores (BMV). See Notes and Definitions at the end of this release for further explanation of terms used herein.
OPERATING RESULTS BY BUSINESS GROUP
VINYL Business Group: 33% and 28% of Mexichem’s sales (after eliminations) and EBITDA, respectively, in 2019.
| mm US$ | Second Quarter | January - June | ||||
| Vinyl | 2019 |
2018 |
%Var. |
2019 |
2018 |
% Var. |
| Volume (K tons) | 636 |
654 |
-3% |
1,262 |
1,298 |
-3% |
| Total sales* | 588 |
642 |
-8% |
1,184 |
1,287 |
-8% |
| Operating income | 46 |
98 |
-53% |
83 |
188 |
-56% |
| EBITDA | 105 |
148 |
-29% |
199 |
286 |
-30% |
| EBITDA wo IFRS | 97 |
148 |
-34% |
184 |
286 |
-36% |
| *Intercompany sales were $39 million and $47 million in 2Q19 and 2Q18, respectively. And as of June 2019 and 2018 were $74 million and $88 million, respectively. | ||||||
During Q2, Vinyl total sales of $588 million were 8% below the second quarter of 2018. The decline resulted mainly due to lower caustic soda prices, and to a lower extent, to lower PVC prices and volume driven by a temporary force majeure of a key supplier in Germany, as well as longer than expected maintenance work in our main VCM supplier’s plant in the U.S. On an organic and constant currency basis, Vinyl sales would have decreased 6%.
During the first half of the year, revenues decreased 8% to $1.2 billion compared to the same period last year, mainly due also to lower caustic soda and PVC prices. On an organic and constant currency basis, revenues decreased 6% .
Q2 reported EBITDA for the Vinyl Business Group of $105 million was 29% below Q2 2018. The decline resulted mainly from the tougher PVC and caustic soda market conditions, which continue to pressure EBITDA margins, resulting in a contraction to 17.9% in Q2 2019 from the 23.0% reported in Q2 2018. On an organic and constant currency basis, EBITDA decreased 33% to $98 million, reflecting an implicit EBITDA margin of 16.3%.
During the first half of 2019, reported EBITDA decreased 30% to $199 million mainly due to a higher proportional decrease in PVC and caustic soda prices compared to ethane prices, which decreased approximately 8%, 45% and 2%, respectively.
Reported EBITDA margin decreased from 22.2% in 1H 2018 to 16.9% during the same period of 2019. On an organic and constant currency basis, EBITDA decreased 34% to $187 million, reflecting an implicit EBITDA margin of 15.4%
Even with Q2 2019 being challenging, we saw a sequential EBITDA margin (without IFRS) improvement when compared to the first quarter, taking it from 14.7% to 16.5%; this while ethane prices declined by approximately 28% while PVC prices declined approximately only 3%. Although these market conditions, as well as caustic soda prices, are expected to be better sequentially on a year on year basis, we expect Vinyl EBITDA margins to be below those experienced in 2018, as we mentioned at the beginning of the year.
FLUENT Business Group: 58% and 44% of Mexichem’s sales (after eliminations) and EBITDA, respectively, in 2019.
| mm US$ | Second Quarter | January - June | ||||||||||
| Fluent | 2019 |
|
2018 |
|
%Var. | 2019 |
|
2018 |
|
% Var. | ||
| Sales | 1,089 |
|
1,144 |
|
-5 |
% |
2,091 |
|
2,090 |
|
0 |
% |
| Fluent LatAm | 272 |
|
278 |
|
-2 |
% |
525 |
|
547 |
|
-4 |
% |
| Fluent Europe | 357 |
|
387 |
|
-8 |
% |
686 |
|
737 |
|
-7 |
% |
| Fluent USA & Canada | 150 |
|
150 |
|
0 |
% |
271 |
|
263 |
|
3 |
% |
| Fluent AMEA | 32 |
|
44 |
|
-27 |
% |
73 |
|
83 |
|
-12 |
% |
| Netafim | 295 |
|
286 |
|
3 |
% |
568 |
|
463 |
|
23 |
% |
| Intercompany eliminations | (17 |
) |
(2 |
) |
750 |
% |
(32 |
) |
(3 |
) |
967 |
% |
| Operating income | 119 |
|
134 |
|
-11 |
% |
186 |
|
191 |
|
-3 |
% |
| EBITDA | 181 |
|
175 |
|
3 |
% |
309 |
|
273 |
|
13 |
% |
| EBITDA wo IFRS | 171 |
|
175 |
|
-2 |
% |
290 |
|
273 |
|
6 |
% |
Fluent Business Group revenues of $1.1 billion in Q2 2019 were down 5% in Q2 from the same quarter last year mainly due to a high single-digit decline in Europe, related in part, to lower revenues in the UK, and a 27% and 2% decrease in Fluent AMEA and Fluent LatAm, respectively. These declines were partly offset by a 3% increase in sales for Netafim. On an organic and constant currency basis, the Fluent Business Group’s revenues were $1.1 billion, flat when compared to the same period last year.
During the first half of the year, Fluent revenues remained stable at $2.1 billion compared with the same period of 2018. On an organic and constant currency basis, revenues would have increased 6% to $2.2 billion.
| 2Q18 | mm US$ | 2Q19 | 2Q19 | 2Q19/2Q18 | |
| Sales | Sales | FX | Total | % Var | |
278 |
Fluent LatAm | 272 |
15 |
287 |
3% |
387 |
Fluent Europe | 357 |
27 |
384 |
-1% |
150 |
Fluent US/Canada | 150 |
- |
150 |
0% |
44 |
Fluent AMEA | 32 |
1 |
33 |
-25% |
286 |
Netafim | 295 |
9 |
304 |
6% |
(2) |
Intercompany Eliminations | (17) |
- |
(17) |
750% |
1,144 |
Total | 1,089 |
52 |
1,141 |
0% |
| mm US$ | Second Quarter | January - June | ||||
| Fluent | 2019 |
2018 |
%Var. |
2019 |
2018 |
% Var. |
| Sales | 1,089 |
1,144 |
-5% |
2,091 |
2,090 |
0% |
| B&I | 626 |
661 |
-5% |
1,206 |
1,275 |
-5% |
| Datacom | 185 |
200 |
-8% |
350 |
359 |
-3% |
| Precision Agriculture | 295 |
286 |
3% |
568 |
463 |
23% |
| Intercompany eliminations | (18) |
(3) |
500% |
(33) |
(7) |
371% |
| Operating income | 119 |
134 |
-11% |
186 |
191 |
-3% |
| EBITDA | 181 |
175 |
3% |
309 |
273 |
13% |
| EBITDA wo IFRS | 171 |
175 |
-2% |
290 |
273 |
6% |
As of June 30, 2019, approximately 4% of our Building and Infrastructure revenues are related to Datacom products that are produced and sold in the Building and Infrastructure legal entities and plants, while approximately 10% of our Datacom sales numbers are not related to Datacom products (mainly associated to the natural gas distribution piping business).
| 2Q18 | mm US$ |
2Q19 | 2Q19 | 2Q19/2Q18 | |
| Sales | Sales | FX | Total | % Var | |
661 |
B&I | 626 |
41 |
667 |
1% |
200 |
Datacom | 185 |
2 |
187 |
-6% |
286 |
Precision Agriculture | 295 |
9 |
304 |
6% |
(3) |
Intercompany Eliminations | (18) |
|
(18) |
500% |
1,144 |
Total | 1,089 |
52 |
1,141 |
0% |
For Q2 2019, our Fluent Business Group reported EBITDA increased 3% to $181 million from $175 million in Q2 2018, with a margin of 16.7%. This positive performance includes stronger results from our Datacom business due to a better mix of products and an improvement in the cost of raw materials, as well as Netafim’s better than expected revenues. On an organic and constant currency basis, Q2 2019 EBITDA would have increased 4% to $179 million.
For the first six months of 2019, reported EBITDA for our Fluent Business Group was $309 million, increasing 13% from $273 million last year. Reported EBITDA margin was 14.8% compared to 13.1% from the same period last year. On an organic and constant currency basis, EBITDA would have increased 6% to $307 million, with an implied EBITDA margin of 13.9%.
FLUOR Business Group: 11% and 24% of Mexichem’s sales (after eliminations) and EBITDA, respectively, in 2019.
| mm US$ | Second Quarter | January - June | ||||
| Fluor | 2019 |
2018 |
%Var. |
2019 |
2018 |
% Var. |
| Sales | 204 |
230 |
-11% |
408 |
434 |
-6% |
| Operating income | 60 |
88 |
-32% |
130 |
155 |
-16% |
| EBITDA | 73 |
100 |
-27% |
157 |
180 |
-13% |
| EBITDA wo IFRS | 73 |
100 |
-27% |
156 |
180 |
-13% |
For Q2 2019, Fluor Business Group sales declined 11% as pricing and volume in Downstream were pressured by incremental illegal imports into the EU. Upstream reported stronger results; however, were not enough to compensate for a lower than expected Downstream business.
As a result, during the first half of the year, revenues decreased by 6%, or $26 million, to $408 million compared with the same period last year.
Reported EBITDA in Q2 2019 decreased 27% to $73 million, reflecting an EBITDA margin of 36.0% compared with 43.4% in Q2 2018, effected mainly by the illegal refrigerant gas imports into the EU, as explained before. On an organic and constant currency basis, Fluor EBITDA decreased 26% to $74 million, with an implied EBITDA margin of 35.8%.
For the first six months of 2019, reported EBITDA was $157 million, a decrease of 13% compared with the same period last year. EBITDA margin was 38.5%. On an organic and constant currency basis, EBITDA decreased 12% to $158 million, reflecting an implicit EBITDA margin of 38.2%.
As stated earlier, Mexichem Fluor’s earnings in Q2 have been materially impacted by the illegal importation and selling of refrigerants into the EU in breach of the EU F-gas regulations. A recent independent assessment by the Environmental Investigation Agency (EIA) estimates that the illegal activity constitutes 16% of the legitimate market while other sources suggest as much as 30%. Mexichem is actively working with industry and government stakeholders in order to facilitate the EU’s efforts to lessen and eliminate these illegal products.
These efforts will take some time to bear results. Meanwhile, we are doing our best to partially offset the impact on earnings for the rest of the year through performance in other parts of the business.
CONSOLIDATED FINANCIAL INFORMATION
REVENUES
For Q2 2019, revenues totaled $1.84 billion, down $129 million, or 7% from Q2 2018. On a constant currency basis, sales by Business Groups were as follows:
| 2Q18 | mm US$ | 2Q19 | 2Q19 | 2Q19/2Q18 | |
| Sales | Sales | FX | Total | % Var | |
642 |
Vinyl | 588 |
13 |
601 |
-6% |
1,144 |
Fluent | 1,089 |
52 |
1,141 |
0% |
1,786 |
Ethylene (Vinyl + Fluent) | 1,677 |
65 |
1,742 |
-2% |
230 |
Fluor | 204 |
3 |
207 |
-10% |
(48) |
Eliminations / Holding | (42) |
- |
(42) |
-13% |
1,968 |
Total | 1,839 |
68 |
1,907 |
-3% |
The countries that represent more than 5% of Mexichem’s consolidated 1H 2019 revenues are: the U.S. 18%; Mexico 9%; Germany 7%; the UK 5%; Brazil 6% and India 5%.
During the first half of the year, revenues decreased to $3.6 billion, a decline of 3% year on year, and on a constant currency basis, revenues increased to $3.8 billion, 1% higher than the same period in 2018.
EBITDA
Consolidated reported Q2 2019 EBITDA was $372 million, 12% below the $423 million reported in the same quarter last year. Reported EBITDA margin for the quarter was 20.2%. Organic and constant currency basis EBITDA was $362 million, 14% below the second quarter last year, reflecting an implicit EBITDA margin of 19.0%.
For the first six months of 2019, reported EBITDA was $690 million, a decrease of 8% compared with the same period last year. EBITDA margin was 19.1%. EBITDA on an organic and constant currency basis declined 12% to $676 million, reflecting an implicit EBITDA margin of 18.0%.
| 2Q18 | mm US$ | 2Q19 | 2Q19 | 2Q19/2Q18 | |
| EBITDA | EBITDA | FX | Total | % Var | |
148 |
Vinyl | 105 |
1 |
106 |
-28% |
175 |
Fluent | 181 |
7 |
188 |
7% |
323 |
Ethylene (Vinyl + Fluent) | 286 |
8 |
294 |
-9% |
100 |
Fluor | 73 |
1 |
74 |
-26% |
- |
Eliminations / Holding | 13 |
- |
13 |
|
423 |
Total | 372 |
9 |
381 |
-10% |
OPERATING INCOME
Mexichem reported operating income for Q2 2019 of $237 million, compared to $317 million reported in Q2 2018, a 25% decrease.
For the 1H 2019, operating income was $423 million, compared to $543 million reported in the same period of 2018, representing a decrease of 22%.
FINANCIAL COSTS
Q2 2019 financial costs increased $23 million or 40% compared to Q2 2018. The increase was mainly due to a $6 million mark-to-market valuation of the financial instrument related to the Netafim acquisition; $4 million of bank commissions related to the renewal of the $1.5 billion Revolving Credit Facility; $4 million of higher interest expense mainly related to interest over tax settlements; $2 million of lease interest related primarily to IFRS 16; and a $19 million decrease in the monetary position in our Venezuelan and Argentinean operations, offset by a decrease of $12 million in foreign exchange losses.
Financial costs for 1H 2019 increased $29 million or 24% above 1H 2018. The increase was mainly due to a $12 million mark-to-market valuation of the financial instrument related to the Netafim acquisition; $9 million of bank commissions related to the renewal of the $1.5 billion Revolving Credit Facility and Netafim refinancing of its bank loan facilities; $3 million less interest earned due to the lower average cash position in Q1 2019 versus Q1 2018; $4 million of higher interest expenses related to the $200 million bilateral loan taken by Mexichem at the end of January 2018 for the Netafim acquisition; $4 million of lease interest related primarily to IFRS 16; and a $21 million decrease in the monetary position in our Venezuelan and Argentinean operations, offset by a decrease of $24 million in foreign exchange losses.
TAXES
In Q2 2019, income (loss) from continuing operations before income taxes declined 39% while cash tax reduced 16%, increasing the cash tax rate from 24% to 33%. This was mainly due to a cash repatriation to Mexico from jurisdictions with low corporate tax rates during Q2 2019 and also Q2 2018 tax gains originating from exchange rate variations offset by tax losses carried forward; variations that did not occur in Q2 2019.
In the first half of 2019, the cash tax rate increased to 38% from 27% in Q2 2018, mainly due to cash repatriation to Mexico from jurisdictions with low corporate tax rates.
CONSOLIDATED NET INCOME (LOSS) AND MAJORITY INCOME (LOSS)
As a result of the above, the Company reported a 45% decline in consolidated net income to $113 million from $206 million in Q2 2018. Net majority income decreased 48% to $84 million from $162 million in Q2 2018.
For the first half of 2019, the Company posted a $190 million consolidated net income and $132 million in net majority income, compared to $317 million and $241 million reported in the same period of 2018, respectively.
| USD in millions | Second Quarter | January - June | ||||||
| Income statement | 2019 |
2018 |
% |
|
2019 |
2019 |
% |
|
| Income (loss) from continuing operations before income tax | 160 |
262 |
-39% |
|
276 |
425 |
-35% |
|
| Cash tax | 52 |
62 |
-16% |
|
106 |
114 |
-7% |
|
| Income (loss) from continuing operations after cash tax | 108 |
200 |
-46% |
|
170 |
311 |
-45% |
|
| Deferred taxes | (5) |
14 |
N/A |
|
(21) |
13 |
N/A |
|
| Income (loss) from continuing operations | 113 |
186 |
-39% |
|
190 |
297 |
-36% |
|
| Discontinued operations | - |
20 |
-100% |
|
(1) |
20 |
N/A |
|
| Consolidated net income (loss) | 113 |
206 |
-45% |
|
190 |
317 |
-40% |
|
| Minority stockholders | 29 |
44 |
-34% |
|
58 |
76 |
-24% |
|
| Net income (loss) | 84 |
162 |
-48% |
|
132 |
241 |
-45% |
|
BALANCE SHEET AND OPERATING CASH FLOW HIGHLIGHTS
OPERATING CASH FLOW HIGHLIGHTS
| Second Quarter | January - June | |||||
| mm US$ | 2019 |
2018 |
%Var. |
2019 |
2018 |
% Var. |
| EBITDA | 372 |
423 |
-12% |
690 |
753 |
-8% |
| Taxes paid | (52) |
(78) |
-33% |
(106) |
(132) |
-20% |
| Net interest paid | (21) |
(22) |
-5% |
(105) |
(96) |
9% |
| Bank commissions | (15) |
(4) |
275% |
(20) |
(7) |
186% |
| Exchange rate gains (losses) | (3) |
(22) |
-86% |
(4) |
(32) |
-88% |
| Change in trade working capital (1) (2) | (64) |
(44) |
45% |
(279) |
(261) |
7% |
| Operating cash flow before capex, buy-back shares program & dividends | 217 |
253 |
-14% |
175 |
225 |
-22% |
| Total CAPEX (organic & JV) | (61) |
(70) |
-13% |
(121) |
(136) |
-11% |
| Operating cash flow before buy-back shares program & dividends | 156 |
183 |
-15% |
54 |
89 |
-39% |
| Buy-back shares program | (1) |
(17) |
-94% |
2 |
(32) |
N/A |
| Operating cash flow before dividends | 155 |
166 |
-7% |
56 |
57 |
-2% |
| Shareholders' dividend | (90) |
(62) |
45% |
(169) |
(136) |
24% |
| Free cash flow | 65 |
104 |
-38% |
(114) |
(79) |
44% |
| (1) PMV's insurance A/R is not included in trade working capital calculation. (2) Trade working capital variation (Jun 18 vs Dec 17) includes Netafim's proforma results for comparative purposes. |
||||||
Second quarter 2019 operating cash flow before CapEx, share buybacks and dividends was negatively effected by: i) $51 million lower EBITDA, ii) higher needs for working capital of $20 million, and iii) higher bank commissions associated with the $1.5 billion Revolving Credit Facility renewal, announced in June 26, 2019. These effects were partly offset by lower taxes and lower FX losses. Capital expenditures decreased 13% to $61 million.
NET WORKING CAPITAL
| 2019 Variation | 2018 Variation | |||||
| jun-19 | dec-18 | Δ ($) | jun-18 | dec-17 | Δ ($) | |
| Trade Working Capital | 881 |
602 |
(279) |
771 |
510 |
(261) |
From December 31, 2018 to June 30, 2019, the change in working capital needs increased to $279 million from $261 million during the same period last year. This increase of $18 million was mainly due to some delays in account receivables in Datacom and Netafim in India; and to a lesser extent, to higher inventories in our Fluor Business Group driven partially by the negative effect caused by the illegal imports into the EU.
FINANCIAL DEBT
| Last Twelve Months | ||||
| Jun 2019 | Dec 2018 | |||
| Net Debt USD million | 2,991 |
2,871 |
||
| Net Debt/EBITDA 12 M | 2.31x |
2.05x |
||
| Interest coverage | 4.62x |
5.59x |
||
Note: Net debt includes $0.1 million of letters of credit with maturities of more than 180 days that for covenant purposes are considered gross debt.
As of June 30, 2019, net financial debt for covenant purposes was $3.0 billion, comprised of total financial debt of $3.6 billion less cash and cash equivalents of $591 million.
Net Debt/EBITDA was 2.31x as of June 30, 2019, while Interest Coverage was 4.62x.
Conference Call Details
Mexichem will host a conference call to discuss our Q2 2019 results on July 25th, 2019 at 10:00am Mexico City/11:00 am (US Eastern Time). To access the call, please dial 001-855-817-7630 (Mexico), 1-888-339-0721 (United States) or 1-412-317-5247 (International). Participants may pre-register for the conference call here.
A recording of the webcast will be posted on our website within several hours after the call is completed. The webcast can be accessed via the following link: https://services.choruscall.com/links/mexichem190725.html
The replay can be accessed via Mexichem’s website at https://www.mexichem.com/.
For all the news, please visit the following webpage https://www.mexichem.com/newsroom/.
CONSOLIDATED INCOME STATEMENT
| USD in millions | Second Quarter | January - June | |||||
| Income Statement | 2019 | 2018 | % | 2019 | 2018 | % | |
| Net sales | 1,839 | 1,968 | -7% | 3,605 | 3,724 | -3% | |
| Cost of sales | 1,324 | 1,393 | -5% | 2,621 | 2,675 | -2% | |
| Gross profit | 514 | 575 | -11% | 983 | 1,048 | -6% | |
| Operating expenses | 278 | 258 | 8% | 560 | 505 | 11% | |
| Operating income (loss) | 237 | 317 | -25% | 423 | 543 | -22% | |
| Financial Costs | 80 | 57 | 40% | 150 | 121 | 24% | |
| Equity in income of associated entity | (2) | (1) | 100% | (3) | (2) | 50% | |
| Income (loss) from continuing operations before income tax | 160 | 262 | -39% | 276 | 425 | -35% | |
| Cash tax | 52 | 62 | -16% | 106 | 114 | -7% | |
| Deferred taxes | (5) | 14 | N/A | (21) | 13 | N/A | |
| Income tax | 47 | 76 | -38% | 85 | 128 | -34% | |
| Income (loss) from continuing operations | 113 | 186 | -39% | 190 | 297 | -36% | |
| Discontinued operations | - | 20 | -100% | (1) | 20 | N/A | |
| Consolidated net income (loss) | 113 | 206 | -45% | 190 | 317 | -40% | |
| Minority stockholders | 29 | 44 | -34% | 58 | 76 | -24% | |
| Net income (loss) | 84 | 162 | -48% | 132 | 241 | -45% | |
| EBITDA | 372 | 423 | -12% | 690 | 753 | -8% | |
| EBITDA wo IFRS 16 effect | 353 | 423 | -17% | 653 | 753 | -13% | |
CONSOLIDATED BALANCE SHEET
| USD in millions | |||
| Balance sheet | Jun 2019 | Dec 2018 | |
| Total assets | 10,405 |
10,062 |
|
| Cash and temporary investments | 591 |
700 |
|
| Receivables | 1,408 |
1,150 |
|
| Inventories | 880 |
866 |
|
| Others current assets | 306 |
262 |
|
| Property, plant and equipment, Net | 3,416 |
3,507 |
|
| Intangible assets and Goodwill | 3,295 |
3,345 |
|
| Right of use Fixed Assets, Net | 298 |
- |
|
| Long term assets | 211 |
232 |
|
| Total liabilities | 7,095 |
6,892 |
|
| Current portion of long-term debt | 431 |
396 |
|
| Suppliers | 1,407 |
1,414 |
|
| Short-term leasings | 73 |
18 |
|
| Other current liabilities | 852 |
881 |
|
| Long-term debt | 3,151 |
3,175 |
|
| Long-term employee benefits | 194 |
182 |
|
| Long-Term deferred tax liabilities | 319 |
349 |
|
| Long-term leasings | 212 |
15 |
|
| Other long-term liabilities | 456 |
462 |
|
| Consolidated shareholders' equity | 3,310 |
3,170 |
|
| Minority shareholders' equity | 742 |
761 |
|
| Majority shareholders' equity | 2,568 |
2,409 |
|
| Total liabilities & shareholders' equity | 10,405 |
10,062 |
|
Notes and Definitions
The results contained in this release have been prepared in accordance with International Financial Reporting Standards (“NIIF” or “IFRS”) having U.S. dollars as the functional and reporting currency. Figures are presented in millions, unless specified otherwise.
Commencing Q1 2019, Business Groups EBITDA are reported inclusive of corporate charges; comparable prior year figures have been adjusted accordingly.
In our continuous effort to better inform the market, and as part of our transformation journey to become a more customer-centric organization, beginning in Q1 2019, we have presented Fluent revenues geographically and by global business division: Building and Infrastructure (Wavin in Europe and Amanco in LatAm), Datacom (Fluent U.S. and Canada and Fluent AMEA – Dura-Line) and Precision Agriculture (Netafim).
Fluent Business Group’s prior year results include those of Netafim as of the February 7, 2018 acquisition closing date.
The terms “Organic Basis” or “Organically” mean figures excluding the effects of IFRS 16 in 2019, CADE and Netafim Ltd. acquisition-related expenses and the Brazilean Tax legal settlement in 2018.
“FX translation effect” figures, which reflect results on a “constant currency” basis or “without FX translation effects,” do not include any positive or negative effect from Venezuela due to the uncertainties of the economic fundamentals of its FX market and due to its immaterial impact on consolidated results.
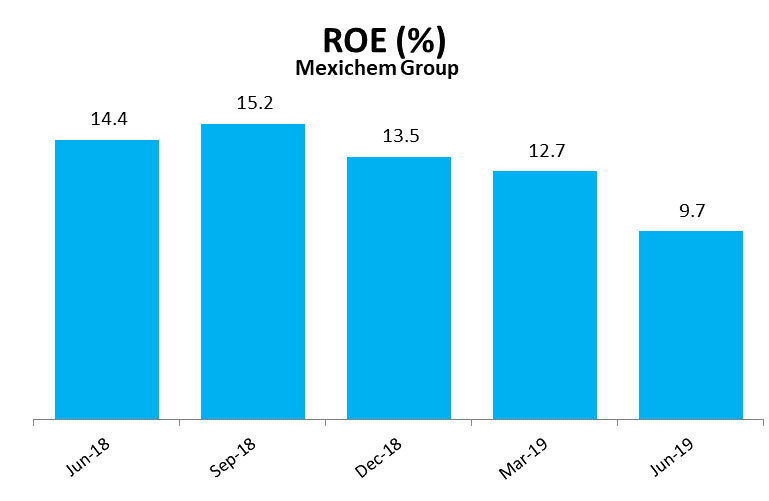
"ROE" means Income from continuing operations / Adjusted Average Equity from continuing operations.
"ROIC" means Adjusted NOPAT from continuing operations/Adjusted Equity from continuing operations plus Liabilities with cost – Cash. Income from continuing operations and NOPAT (EBIT – taxes) consider trailing 12 months.
Figures and percentages have been rounded and may not add up.
ABOUT MEXICHEM
Mexichem is a global leading supplier of innovative solutions across multiple industries including building and infrastructure, data communications, irrigation and chemicals, and more. With operations in 41 countries, 137 facilities worldwide and more than 22,000 employees, Mexichem has the rights to produce fluorspar in two mines in Mexico, as well as 8 training academies and 19 R&D labs. Operations are divided into three Business Groups: Fluent, Vinyl and Fluor. Mexichem has annual revenues of U.S. $7.2 billion and has been traded on the Mexican Stock Exchange for more than 30 years. The company is a member of the Mexican Stock Exchange Sustainability Index and the sustainability emerging markets index FTSE4Good.
Prospective Information
In addition to historical information, this press release contains "forward-looking" statements that reflect management's expectations for the future. The words “anticipate,” “believe,” “expect,” “hope,” “have the intention of,” “might,” “plan,” “should” and similar expressions generally indicate comments on expectations. The final results may be materially different from current expectations due to several factors, which include, but are not limited to, global and local changes in politics, the economy, business, competition, market and regulatory factors, cyclical trends in relevant sectors; as well as other factors that are highlighted under the title “Risk Factors” in the annual report submitted by Mexichem to the Mexican National Banking and Securities Commission (CNBV). The forward-looking statements included herein represent Mexichem’s views as of the date of this press release. Mexichem undertakes no obligation to revise or update publicly any forward-looking statement for any reason unless required by law.”
Mexichem has implemented a Code of Ethics that rules our relationships with our employees, clients, suppliers and general groups. Mexichem’s Code of Ethics is available for consulting in the following link: http://www.mexichem.com/Codigo_de_etica.html. Additionally, according to the terms contained in the Securities Exchange Act No 42, the Mexichem Audit Committee established a mechanism of contact, which allows that any person that knows the unfulfillment of operational and accounting records guidelines and lack of internal controls of the Code of Ethics, from the Company itself or from the subsidiaries that this controls, can file a complaint which is anonymously guaranteed. The whistleblower program is facilitated by a third party. The telephone number in Mexico is 01-800-062-12-03. The website is http://www.ethic-line.com/mexichem and contact e-mail is mexichem@ethic-line.com. Mexichem’s Audit Committee will be notified of all complaints for immediate investigation.
INDEPENDENT ANALYSTS
EQUITY COVERAGE FROM THE LAST TWELVE MONTHS:
- Actinver
- Bank of America Merrill Lynch
- Banorte-Ixe
- Barclays
- BBVA Bancomer
- Bradesco
- BTG Pactual
- Citigroup
- Credit Suisse
- GBM-Grupo Bursátil Mexicano
- HSBC
- Intercam
- Invex Casa de Bolsa
- Itau
- JPMorgan
- Morgan Stanley
- Santander
- Scotiabank
- UBS
- Vector
RECONCILIATION OF LEASE LIABILITIES
| Mexichem, S.A.B. de C.V. and Subsidiaries | ||
| Reconciliation of lease liabilities in millions US | ||
| Weighted average lessee’s incremental borrowing rate | 4.61% |
|
| 01/01/2019 | ||
| Off-balance lease obligation as of 12/31/2018 | 307 |
|
| Current leases with a lease term of 12 months or less (short-term leases) | (46) |
|
| Leases of low-value-assets (low-value leases) | (5) |
|
| Variable leases payments | - |
|
| Operating lease obligations as of 01/01/2019 (gross, without discounting) | 256 |
|
| Operating lease obligations as of 01/01/2019 (net, discounted) | 208 |
|
| Reasonably certain extension or termination options | 44 |
|
| Residual value guarantees | - |
|
| Non-lease-components | - |
|
| Lease liabilities due to initial application of IFRS 16 as of 01/01/2019 | 252 |
|
| Lease liabilities from finance leases as of 01/01/2019 | 33 |
|
| Total lease liabilities as of 01/01/2019 | 285 |
INTERNAL CONTROL
Mexichem’s bylaws provide the existence of the Audit and Corporate Practices Committees, intermediate corporate organs constituted in agreement with the applicable law to assist the Board of Directors to carry on their functions. Through these committees and the external auditor, it is given reasonable safety that transactions and company acts are executed and registered in accordance with the terms and parameters set by the Board and directives of Mexichem, the applicable law and different general guidelines, criterion and IFRS (International Financial Reporting Standards).