CHICAGO--(BUSINESS WIRE)--Please replace the release dated April 4, 2016 with the following corrected version due to changes in the headline and body of the release. The multimedia asset has also been corrected.
The corrected release reads:
US PENSION FUND FITNESS TRACKER: FUNDING RATIOS DROP 4% IN Q1 AS LIABILITIES SURGE AMID FALLING RATES
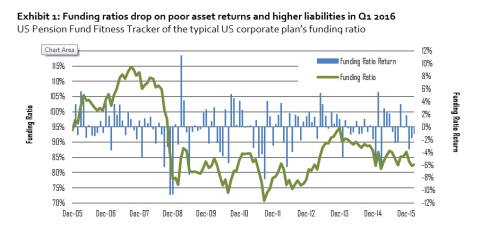
The UBS Asset Management US Pension Fund Fitness Tracker saw the funding ratio of the typical corporate US pension plan drop by approximately four percentage points to 83% in the first quarter of 2016.
"Markets continue to show high volatility across asset classes. Plans implementing downside protection strategies, including LDI and equity collars, have benefitted from the ability to tactically adjust market exposures," said Frank van Etten, head of Investment Solutions at UBS Asset Management.
The large decrease in Treasury yields caused liability values to surge in the first quarter of 2016. Investment returns of 1.5% were dwarfed by the return on liabilities over the quarter, causing funding ratios to decrease. These estimates are based on the average corporate plan’s reported asset allocation weightings from the UBS Asset Management Pension 500 Database and publicly available benchmark information.
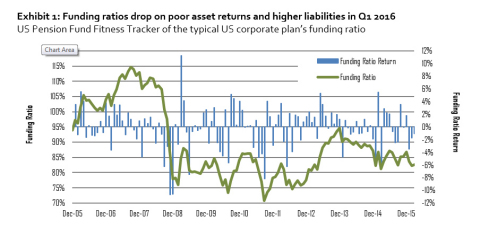
Exhibit 1: Funding ratios drop on poor asset returns and higher liabilities in Q1 2016
US Pension Fund Fitness Tracker of the typical US corporate plan’s funding ratio
Source: UBS Asset Management, Barclays, Markit.
The economic picture evolved in the first quarter of 2016 with continued growth and no real surprises in the US, but with a heightened sense of concern about low inflation in both the Eurozone and Japan. Specifically, both the European Central Bank and the Bank of Japan scaled up their unconventional monetary policies, with more negative interest rates and higher asset purchases, given that the respective inflation rates have been hovering around zero since late 2014 for the Eurozone and since last summer for Japan. Negative interest rates are a concern because they depress aggregate demand since buyers, particularly of big-ticket items, have an incentive to delay their purchases waiting for lower prices.
Low inflation is an issue also because it shows that producers have limited pricing power and therefore cannot increase their margins. This does not bode well for equity prices, despite the recent rally.
Emerging markets have continued on a rather dismal trend, with Latin America (except Argentina) more and more affected by political instability that has been triggered by a commodity price fall, and by economic policies that have been based on the assumption that commodity prices could only go up. Asia has been dragged by India, which has been growing fast, but is seeing significant political unrest, and by China, which has been trying to square the circle by introducing economic and political reforms that could increase both GDP and population well-being without loosening the power of the Communist Party.
During the first quarter, equity markets saw mixed performance. The S&P 500 Index ended the quarter slightly up, with a total return of 1.35%. The Euro Stoxx Total Return Index was down 1.96%, in US dollar (USD) terms, over the quarter. The MSCI Emerging Markets Total Return Index ended the quarter 5.75% higher in USD terms.
The yield on 10-year US Treasury notes ended the quarter down 50 basis points (bps) at 1.77%. The yield on 30-year US Treasury bonds decreased 41 bps, ending at 2.61%. High-quality corporate bond credit spreads, as measured by the Barclays Long Credit A+ option-adjusted spread, ended the quarter 3 bps wider. As a result, pension discount rates (which are based on the yield of high-quality investment grade corporate bonds) decreased over the quarter. The passage of time caused liabilities for a typical pension plan to increase by about one percentage point over the quarter. Together, these effects caused liabilities to increase 6.6% for the quarter. (Please see disclosures for assumptions and methodology.)
Disclosures and methodology
Funding ratio
Funding ratios measure a pension fund’s ability to meet future payout obligations to plan participants. The main factors impacting the funding ratio of a typical US defined benefit plan are equity market returns, which grow (or shrink) the asset pool from which plan participants’ benefits are paid, and liability returns, which move inversely to interest rates.
Liability indices: Methodology
Pension Protection Act (PPA) liability returns are approximated by the Barclays Capital US Long Credit A-AAA Index. This index broadly reflects the duration and credit characteristics of the PPA discount curve that is used to discount expected pension benefit payments for US defined benefit pension plans.
Asset index: Methodology
UBS Asset Management approximates the return for the ”typical” US defined benefit plan using the reported asset allocation of the UBS Asset Management Pension 500 Database. The series is constructed using the aggregate asset allocation weightings and publicly available benchmark information, with geometrically linked monthly total returns.
Pension Fund Fitness Tracker: Methodology
The US Pension Fund Fitness Tracker is the ratio of the asset index over the liability index. Assuming all other factors remain constant, it combines asset and liability returns, and measures the impact of a “typical” investment strategy on the funding ratio of a model defined benefit plan in the US due to interest rollup, change in interest rates and typical asset performance, but excludes unique plan factors, such as service cost and benefit payments. The impact of changes in mortality tables on liabilities in 2014 and 2015 was estimated to be +6% and -2%, respectively.
The UBS Asset Management Pension 500 Database
The UBS Asset Management Pension 500 Database is a proprietary database that is based on the analysis of 500 public companies sponsoring large defined benefit plans. The information was extracted from the companies’ 10-K statements, and therefore represents generally accepted accounting principles (GAAP) information. The study may include figures for companies’ nonqualified and foreign plans, both of which are not subject to ERISA. The aggregate asset allocation is based on an equally weighted average of the 500 companies included in the database. The aggregate asset allocation includes equities, fixed income, hedge funds, private equity, real estate and cash.


