Newsroom
Sorted by: Latest
-
Skillsoft Announces New Employee Inducement Grant Under NYSE Rule 303A.08
BOSTON--(BUSINESS WIRE)--Skillsoft (NYSE: SKIL) (“Skillsoft” or the “Company”), the leading AI-native skills management platform built for the human + AI era, today announced that on February 18, 2026, the Talent and Compensation Committee of Skillsoft’s Board of Directors made a grant of 25,000 restricted stock units (“RSUs”) of the Company’s Class A common stock to David Koehn. The grant of RSUs was offered as a material inducement to Mr. Koehn’s hiring as SVP, Product Management on January 5...
-
Skillsoft Announces New Employee Inducement Grant Under NYSE Rule 303A.08
BOSTON--(BUSINESS WIRE)--Skillsoft (NYSE: SKIL) (“Skillsoft” or the “Company”), the leading AI-native skills management platform built for the human + AI era, today announced that on February 18, 2026, the Talent and Compensation Committee of Skillsoft’s Board of Directors (the “Committee”) made a grant of 95,000 restricted stock units (“RSUs”) of the Company’s Class A common stock to Bernard Barbour. The grant of RSUs was offered as a material inducement to Mr. Barbour’s hiring as Chief Techno...
-
Nauta Launches Tariff Recovery Module to Help Shippers Calculate Exposure and Accelerate Refund Claims
NEW YORK--(BUSINESS WIRE)--Nauta, the AI-native operating system for global supply chains, today announced the Nauta Tariff Recovery Module, designed to help shippers automatically calculate tariff exposure and generate a complete, broker-ready data package within minutes. The decision by the U.S. Supreme Court to strike down tariffs implemented under the IEEPA is expected to trigger a complex and time-sensitive refund process for shippers. The Nauta Tariff Recovery Module gives shippers the ab...
-
Cobalt AI Launches Advanced Data Infrastructure for AI Labs
SAN FRANCISCO--(BUSINESS WIRE)--Cobalt AI provides AI labs and investors with expert-curated datasets from Mayo Clinic physicians, SpaceX executives, and more....
-
Andersen Consulting styrker rådgivning inden for bygningsaktiver gennem samarbejde med Grinity
SAN FRANCISCO--(BUSINESS WIRE)--Andersen Consulting har indgået en samarbejdsaftale med Grinity, et rådgivningsfirma med speciale i bygningsaktiver, der leverer tekniske, miljømæssige og bæredygtige udviklingstjenester til bygge- og ejendomsmarkederne. Med sæde i Tjekkiet og Slovakiet og mere end 130 specialister betjener Grinity private og offentlige kunder inden for kommerciel udvikling, industri, teknologi, bilindustri og bæredygtighed. Virksomheden tilbyder tværfaglig ekspertise inden for p...
-
Community West Bancshares Announces Retirement of Board Member Tom L. Dobyns
FRESNO, Calif.--(BUSINESS WIRE)--The Board of Directors (“Board”) of Community West Bancshares (“Company”) (NASDAQ: CWBC), the parent company of Community West Bank (“Bank”), announced today that Tom L. Dobyns has elected to retire from the Boards of Directors of the Company and the Bank, effective March 31, 2026. Mr. Dobyns joined the Community West Bancshares and Community West Bank Boards of Directors on April 1, 2024, following the completion of the Company’s transformative merger. He previ...
-
Hamilton ETFs Announces February 2026 Monthly & Upcoming Semi-Monthly Cash Distributions
TORONTO--(BUSINESS WIRE)--Hamilton ETFs Announces February 2026 Monthly & Upcoming Semi-Monthly Cash Distributions...
-
RCI Receives Anticipated Nasdaq Letter Related to 1Q26 10-Q
HOUSTON--(BUSINESS WIRE)--On February 18, 2026, RCI Hospitality Holdings, Inc. (Nasdaq: RICK) received, as anticipated, a letter from the Nasdaq Stock Market notifying the Company of its continued noncompliance with Listing Rule 5250(c)(1) requiring the timely filing of reports with the SEC. Nasdaq sent the letter in connection with RCI not yet filing its Form 10-Q for the fiscal 2026 first quarter ended December 31, 2025, and because RCI remains delinquent in filing its Form 10-K for the year...

-
Don Hummer Trucking Named 2026 TCA Elite Fleet Certified Carrier for Second Consecutive Year
CEDAR RAPIDS, Iowa--(BUSINESS WIRE)--Don Hummer Trucking is proud to announce it has been recognized as a 2026 TCA Elite Fleet Certified Carrier by the Truckload Carriers Association (TCA), marking the company’s second consecutive year earning this distinction. The TCA Elite Fleet Program, now in its second year, recognizes North American truckload carriers that demonstrate excellence in driver experience, safety culture, operational performance, and workplace quality. The certification process...
-
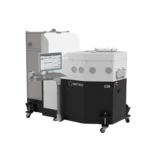
キンコーオプティカル株式会社、XRグラス向け高性能AR導波管の量産にBeneq C2R™を採用
台中(台湾)--(BUSINESS WIRE)--(ビジネスワイヤ) -- アジアを代表するODMであるキンコー・オプティカル(キンコー)は、べネックのC2R™プラズマ強化空間ALDシステムを導入することを発表しました。これにより、キンコーはパートナー企業向けに、回折導波管上に高屈折率で低損失のギャップフィリング光学コーティングの量産が可能になります。 エクステンデッド リアリティ(XR)分野は、XRグラスなどのコンシューマーエレクトロニクスにおける没入型AR体験に対する需要に支えられ、急速な成長を遂げています。近年では、世界をリードするテクノロジー企業やOEM(相手先ブランド製造)による大規模投資とイノベーションが生まれています。XRグラスの中核となるのは、デジタル画像を現実世界にシームレスに重ね合わせるために不可欠なAR向け導波路です。この最適な性能を実現するため、先進表面レリーフ グレーティング(SRG+)とナノ インプリント リソグラフィー(NIL)技術が、コンシューマー向けアプリケーションの性能、生産、コスト要件を満たす主要なプラットフォームとなっています。 ただし、これら...