

Newsroom
Sorted by: Latest
-
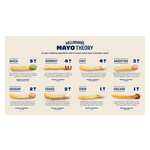
Hellmann’s Is Helping Canadians Taste Victory With a New Match Day Ritual: Mayo on Fries
TORONTO--(BUSINESS WIRE)--As Canadians gear up to host soccer’s biggest moment, the prospect of getting a win, the nation’s first, on home soil is tantalizing. To swing things in Canada’s favour, Hellmann's, the official condiment partner of Canada Soccer, has enlisted Alistair Johnston, defender for Canada’s Men's National Team, to encourage fans to try a new ritual: putting mayo on fries. Except for Quebec and parts of Eastern Canada, much of the country defaults to ketchup when eating fries....
-
UK Debt Management Office UK Regulatory Announcement: Issue of Debt
LONDON--(BUSINESS WIRE)-- Minster Court 21 Mincing Lane London EC3R 7AG T 020 7862 6500 www.dmo.gov.uk 9 June 2026 PRESS NOTICE SYNDICATED RE-OPENING OF £9.0 BILLION OF 5¼% TREASURY GILT 2041: RESULT The United Kingdom Debt Management Office (DMO) announces that the syndicated re-opening of £9.0 billion (nominal) of 5¼% Treasury Gilt 2041 has been priced at £99.033 per £100 nominal, equating to a gross redemption yield of 5.3454%. The transaction will settle, and this tranche of...
-
HSBC Bank Plc UK Regulatory Announcement: FRN Variable Rate Fix
LONDON--(BUSINESS WIRE)-- 08-June-2026 Issue: COVENTRY BUILDING SOCIETY Series 15 XS2596604590 Pursuant to our appointment as Agent for the above stated issue, please be advised of the following interest rate determination: Date From: 16-March-2026 Date To: 15-June-2026 Record Date: 12-June-2026 Value Date: 15-June-2026 Benchmark Rate: 3.7466% Margin: 0.5% Total Rate: 4.2466% Floor: 0% Number of Days: 91 Day Count: Actual / 365 (Fixed) Interest Frequency: Quarterly Denomination: GBP 1,000.00 A...
-
USAA Life Insurance Company Expands Portfolio to Help Families Prepare for End-of-Life Expenses
SAN ANTONIO--(BUSINESS WIRE)--USAA Life Insurance Company is expanding its life insurance portfolio to better serve members at every stage of life with a new life insurance offering designed not only to help cover end-of-life expenses, but to encourage meaningful conversations that ensure families are prepared and protected. With the introduction of USAA SecureTM Final Expense Whole Life Insurance, USAA is providing more member value and redefining end-of-life planning not as a transaction, but...
-
Martha Stewart x Trex: the Ultimate Outdoor Living Collaboration
WINCHESTER, Va.--(BUSINESS WIRE)--When you want the absolute best for your home, there’s one name that instantly comes to mind – Martha Stewart – and when she wanted the absolute best for her home, there was only one name that came to mind – Trex®. This match made in home-design heaven has evolved into a noteworthy collaboration aimed at bringing inspiration, expert insights and empowerment to those looking to elevate their outdoor spaces. “Partnering with Martha Stewart feels incredibly natura...

-
First Trust Global Funds PLC UK Regulatory Announcement: Net Asset Value(s)
LONDON--(BUSINESS WIRE)-- Funds Date TIDM ISIN Code Shares in Issue Currency Net Asset Value NAV/per Share First Trust Vest Nasdaq-100® Moderate Buffer UCITS ETF - March 08.06.2026 QMAR.LN IE0006S0EBF2 50,002.00 USD 1,235,990.58 24.719 ...
-
First Trust Global Funds PLC UK Regulatory Announcement: Net Asset Value(s)
LONDON--(BUSINESS WIRE)-- Funds Date TIDM ISIN Code Shares in Issue Currency Net Asset Value NAV/per Share First Trust Bloomberg Artificial Intelligence UCITS ETF 08.06.2026 FTAI IE000YIQZ0H6 200,002.00 USD 6,055,490.71 30.277 ...
-
First Trust Global Funds PLC UK Regulatory Announcement: Net Asset Value(s)
LONDON--(BUSINESS WIRE)-- Funds Date TIDM ISIN Code Shares in Issue Currency Net Asset Value NAV/per Share First Trust Vest U.S. Equity Max Buffer UCITS ETF- June 08.06.2026 MJUN LN IE000CO3P697 150,002.00 USD 3,797,719.48 25.318 ...
-
Smarter AI for Law Firms: 8am™ Launches New 8am IQ Capabilities to Eliminate Blind Spots in Legal Data
AUSTIN, Texas--(BUSINESS WIRE)--8am™, the professional business platform purpose-built for the needs of legal, accounting, and client-focused professionals, today introduced new capabilities for 8am IQ designed to solve one of legal’s biggest challenges: inaccessible and fragmented data. With the launch of 8am IQ Discovery Assistant, which brings image-to-text OCR directly into 8am MyCase, and a more powerful 8am IQ Case Assistant, legal professionals can use AI to spend less time searching for...
-
First Trust Global Funds PLC UK Regulatory Announcement: Net Asset Value(s)
LONDON--(BUSINESS WIRE)-- Funds Date TIDM ISIN Code Shares in Issue Currency Net Asset Value NAV/per Share First Trust Vest Nasdaq-100 Moderate Buffer UCITS ETF - December 08.06.2026 QDEC.LN IE000GAKWFA7 450,002.00 USD 10,875,704.45 24.168 ...