

Newsroom
Sorted by: Latest
-
American Senior Communities Rejects Patchwork of Tools and Instead Standardizes All Transitions of Care with Olio
INDIANAPOLIS--(BUSINESS WIRE)--ASC expands with Olio and becomes the first SNF operator to manage transitions of care from admissions through post-discharge on a single platform....
-
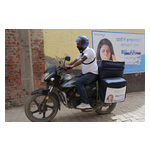
Haleon tätigt Investitionen in Indien, um die alltägliche Gesundheitsversorgung in ländlichen Gemeinden zu verbessern
LONDON--(BUSINESS WIRE)--Haleon, ein Konsumgüterunternehmen, dessen Schwerpunkt ausschließlich auf der Verbesserung der alltäglichen Gesundheit liegt, kündigt heute seine Pläne zur Ausweitung seiner Geschäftstätigkeit in Indien an, einem seiner am schnellsten wachsenden Märkte und einem Schlüsselmarkt für Haleon, um seine Strategie umzusetzen und sein Ziel zu erreichen, bis 2030 eine Milliarde weitere Verbraucher zu erreichen. Haleon wird etwa 175 Millionen Pfund2 in den Bau einer neuen Produkt...

-
Aditxt Signed Definitive Agreement Valuing Ignite Proteomics at Approximately $150 Million
MOUNTAIN VIEW, Calif. & GOLDEN, Colo. & HONG KONG--(BUSINESS WIRE)--Aditxt, Inc. (NASDAQ: ADTX) (“Aditxt”), a qualified acquisition corp and Ignite Proteomics, LLC (“Ignite”, or “Ignite Proteomics”), a functional proteomics company and 100%-owned subsidiary of Aditxt, today announced that Ignite and strategic counterparty agreed to sign a definitive business combination agreement. The transaction values Ignite at an implied equity value of approximately $150 million, subject to the terms and co...
-
Riassunto: Haleon investe in India per migliorare la salute quotidiana delle comunità rurali
LONDRA--(BUSINESS WIRE)--Haleon, azienda di beni di consumo incentrata unicamente sul miglioramento della salute quotidiana, oggi annuncia i piani di ampliamento della sua attività commerciale in India, uno dei mercati in più rapida crescita, fondamentale per consentire ad Haleon di realizzare la sua strategia e le sue ambizioni per raggiungere un altro miliardo di consumatori entro il 2030. Il testo originale del presente annuncio, redatto nella lingua di partenza, è la versione ufficiale che...

-
Samenvatting: Haleon investeert in India om landelijke gemeenschappen een betere dagelijkse gezondheid te bieden
LONDEN--(BUSINESS WIRE)--Haleon, een consumentenbedrijf dat zich uitsluitend toelegt op betere dagelijkse gezondheid, kondigde vandaag plannen aan om zijn bedrijfsactiviteiten uit te breiden in India, een van de snelst groeiende markten en belangrijk voor Haleon in het verwezenlijken van zijn strategie en ambities om tegen 2030 één miljard meer consumenten te bereiken. Deze bekendmaking is officieel geldend in de originele brontaal. Vertalingen zijn slechts als leeshulp bedoeld en moeten worden...

-
Haleon investe na Índia para proporcionar melhor saúde no dia a dia às comunidades rurais
LONDRES--(BUSINESS WIRE)--A Haleon, empresa de bens de consumo focada em melhorar a saúde no dia a dia, anuncia planos para expandir seus negócios na Índia, um de seus mercados de crescimento mais rápido e fundamental para concretizar sua estratégia de alcançar mais um bilhão de consumidores até 2030. A empresa investirá aproximadamente 175 milhões de libras2 na construção de uma nova fábrica de produtos de saúde bucal em Madhya Pradesh, no centro da Índia, e acelerará os esforços de distribuiç...

-
Barclays Renews Long‑Standing Credit Card Partnership with Barnes & Noble
WILMINGTON, Del.--(BUSINESS WIRE)--Barclays US Consumer Bank today announced the long‑term renewal of its exclusive co‑branded credit card partnership with Barnes & Noble, the nation’s largest retail bookseller. The renewed agreement reinforces a collaboration that has delivered meaningful value to book lovers since 2006 and continues to provide cardmembers with rewards designed specifically for Barnes & Noble customers. The Barnes & Noble Mastercard®, exclusively issued by Barclays...
-
Haleon invierte en la India para mejorar cada día la salud de las comunidades rurales
LONDRES--(BUSINESS WIRE)--Haleon, una empresa de productos de consumo dedicada exclusivamente a mejorar la salud diaria, anuncia los planes de expansión de su negocio en la India, uno de sus mercados de más rápido crecimiento y clave para que Haleon pueda cumplir su estrategia y sus ambiciones de llegar a mil millones de consumidores más para 2030. Lo invertido por Haleon ascenderá a aproximadamente 175 millones de libras esterlinas2 en la construcción de una nueva planta de fabricación de prod...
-
VENU CEO JW Roth Shares Business Update in Latest “VENU Capital Conversations” Episode
COLORADO SPRINGS, Colo.--(BUSINESS WIRE)--Venu Holding Corporation ("VENU" or the "Company") (NYSE AMERICAN: VENU), an owner, operator, and developer of premium live entertainment destinations, today released Episode 2 of its investor Q&A series, VENU Capital Conversations featuring VENU® Founder, Chairman, and CEO JW Roth. In the episode, Roth addresses several key milestones and strategic developments, including the recent close of a $49.7 million sale-leaseback transaction in Colorado Sp...

-
Samson Rock Capital LLP UK Regulatory Announcement: Form 8.3
LONDON--(BUSINESS WIRE)-- Ap27 FORM 8.3 IRISH TAKEOVER PANEL OPENING POSITION DISCLOSURE/DEALING DISCLOSURE UNDER RULE 8.3 OF THE IRISH TAKEOVER PANEL ACT, 1997, TAKEOVER RULES, 2022 BY PERSONS WITH INTERESTS IN RELEVANT SECURITIES REPRESENTING 1% OR MORE 1. KEY INFORMATION (a) Full name of discloser SAMSON ROCK CAPITAL LLP (b) Owner or controller of interests and short positions disclosed, if different from 1(a) The naming of nominee or vehicle companies is insufficient. For a trust, the trus...